97% reduction in defects

Need

The stator manufacturing line needed to reduce the number of items going to reprocessing and scrap. To achieve this goal, they were looking for a solution in which it would be possible to identify the most recurrent defects and record them while still on the production line, by the operators themselves. With this data, it would be possible to anticipate the discovery of defects, corrective actions could be taken to deal with the situation momentarily and preventive actions could be taken to avoid the same defects happening in the future.

Another need was to keep a history of the classification of the number and types of defects, so that the company could monitor the evolution of solutions and use them as a guide to solve the most recurrent and important cases. The goal was to reduce the occurrence of product reprocessing and scrap by around 80%.

System implemented in: Brazil and Mexico

Existing situation

The production line in question has a lot of manual work, where variation between the various people working on it is inherent. There was already a way of calculating defects, but they were only checked after the product was finished, which meant that the rate of reprocessing and scrapping was high.

In addition, the mechanism for computing defects did not take into account SPC methodology, which would have helped them not only to identify defects, but also to predict their possible occurrence before they happened, so defects occurred, and in the check the product was reprocessed or scrapped.

Solution implemented

A SPC (Statistical Process Control) solution was implemented, the SPC modality in question was Attribute SPC, i.e. counting defects and presenting the statistical results in Pareto Charts.

The solution implemented was modeled on 2 integrated systems, the RDE System (Defect Tracking in Stators) and the InfinityQS SPC System (Statistical Process Control) (click here to learn more about InfinityQS).

The RDE System is a system developed by HarboR to collect information on defects on the line and send this information to the InfinityQS database. This system manages the collection flow, allowing the operator to report defects without having to leave their workstation.

The InfinityQS system is a SPC system distributed in Latin America exclusively by HarboR. One of the features of this system is Statistical Process Control by Attributes, i.e. you can define Specification Limit ranges (maximum and minimum defect limits) for visual analysis by operators, as the data on the number of parts produced (sent by the RDE based on the presence sensors) and the number/type of defects was added to the InfinityQS database, it performed the statistical calculations to generate the Pareto Chart and alarms (when there was some kind of violation).

The scope of this solution included:

  • Modeling and design of the complete solution
  • Supply and installation of hardware (sensors, terminals, boards, PCs, etc.)
  • Supply of InfinityQS System Licenses
  • RDE System Development
  • Implementation of InfinityQS
  • Implementation of the RDE
  • Registration of all the information required for project start-up
  • Training and documentation
  • Monitoring the start of use
RDE Solution Architecture – InfinityQS

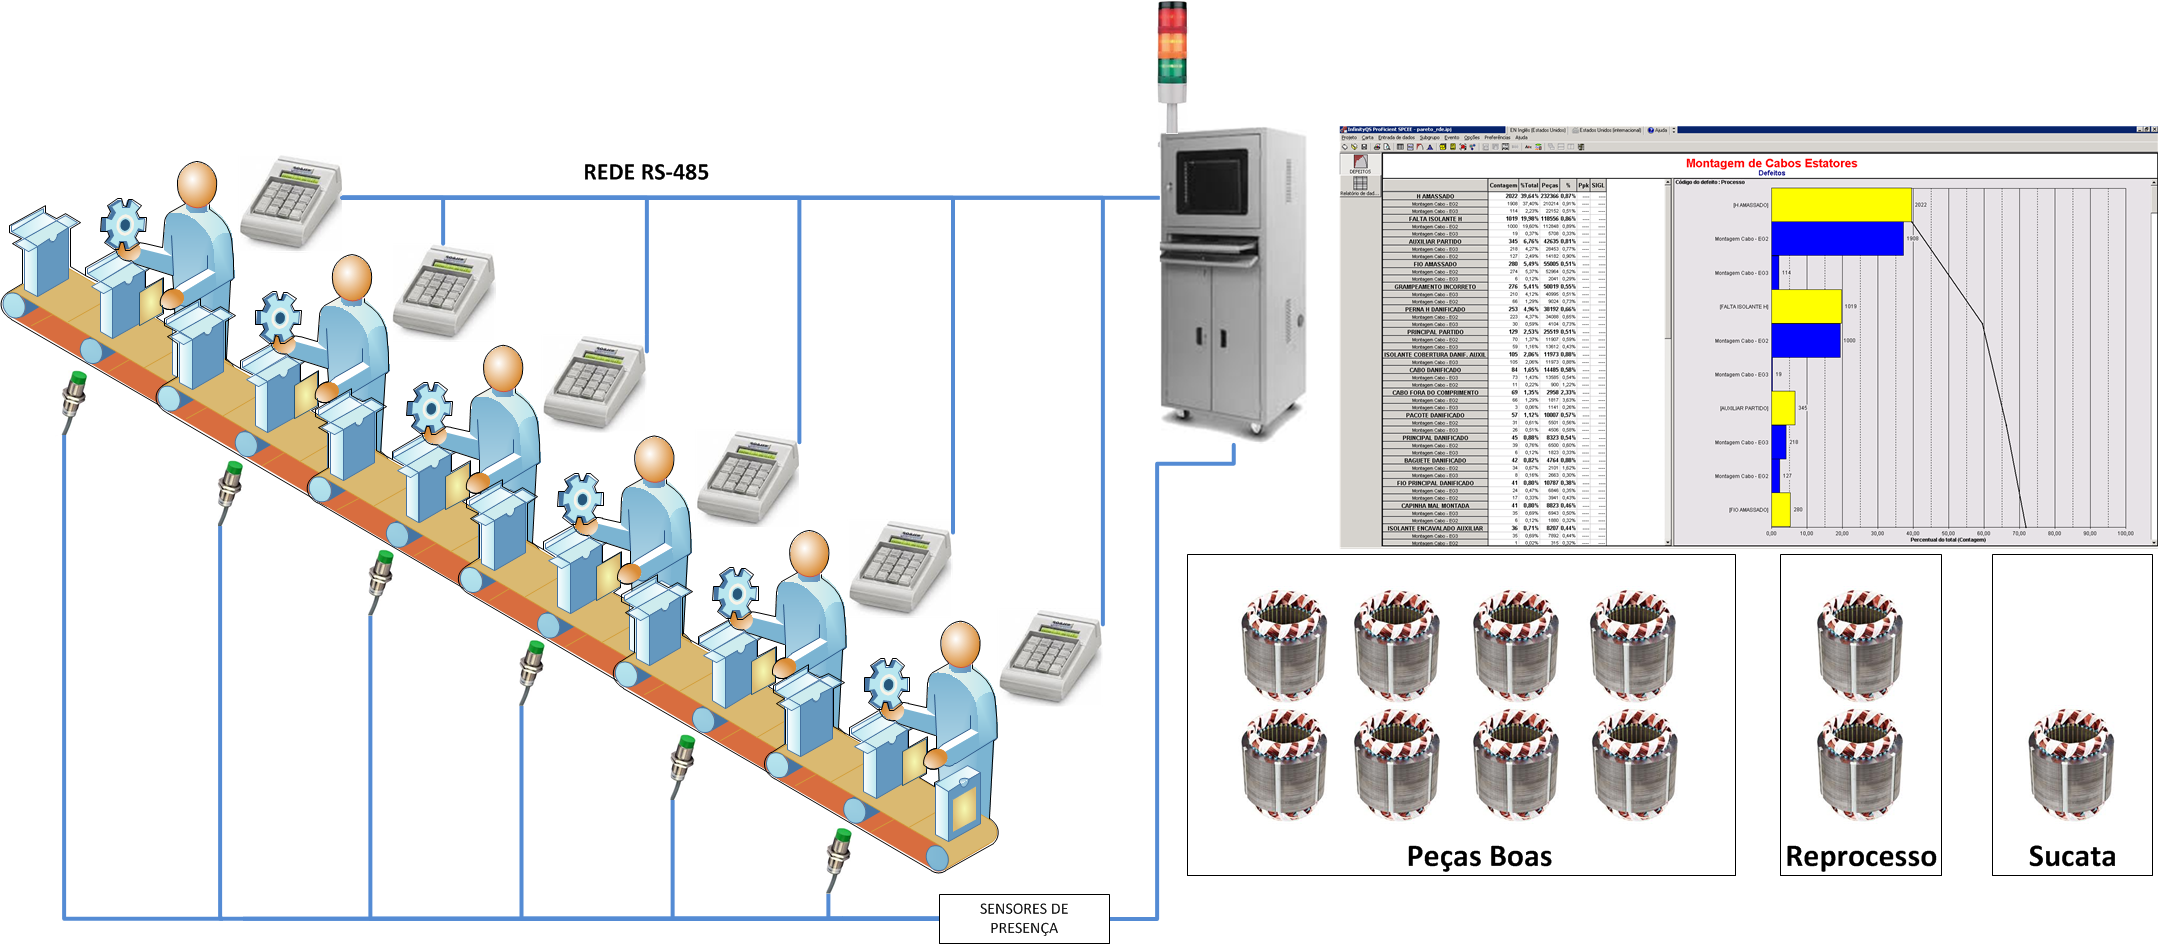
The RDE System uses the presence sensor to know how many parts have been produced at which station/operation on the line, so whenever a part passes in front of one of the sensors, the system knows from the sensor which station the part was produced at and counts it.

As it is not possible to take a PC to each operator’s workstation, we opted for a solution where defects are collected using a device called a 16-key microterminal with a 2-line display. This equipment is similar to bank terminals where the card and password are swiped, but it is designed for an industrial environment. We chose to use this equipment due to its ease of use, ease of replacement and low cost.

To use these terminals, a numerical coding scheme was designed, so for each fault there was a numerical code. With the 2-line display, messages can be sent to instruct the operator to do the correct procedure. Messages, for example, with a description of the fault (so that the operator can be sure that he is calculating the correct fault), product change messages, product model, etc….

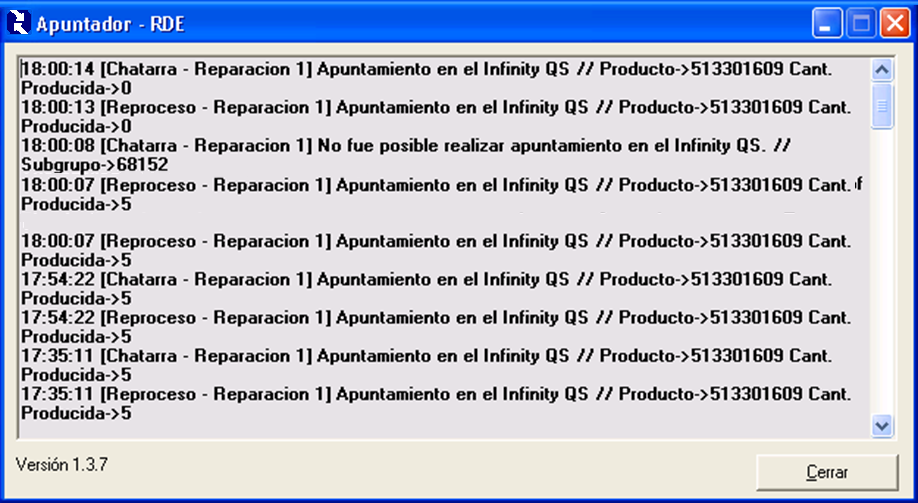
The RDE has the 2 pieces of information needed to make Attribute CEP, the quantity produced (detected by the presence sensors) and the number/type of defects that have occurred. This data is therefore sent directly to the InfinityQS database.

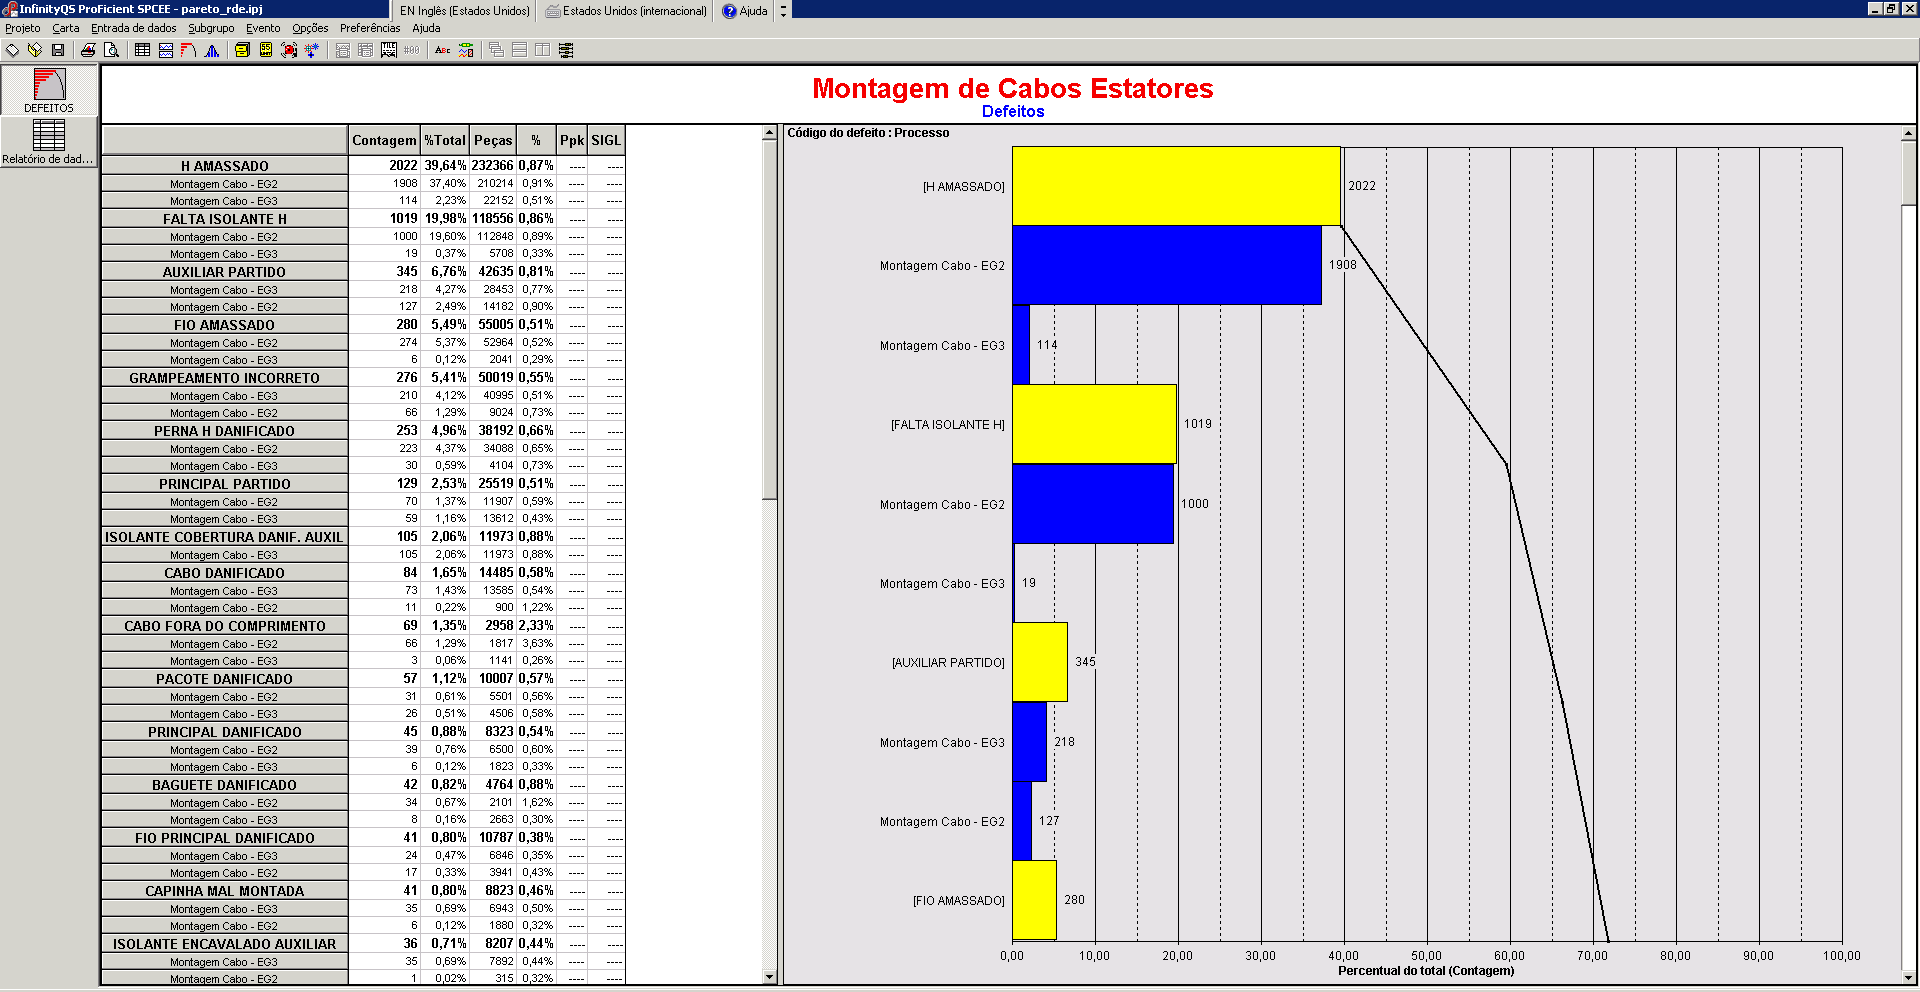
Once in the InfinityQS database, on any PC (with InfinityQS installed), all you have to do is open a project with Attribute ZIP Code charts and the statistical analysis is done when the chart is loaded. In the case of the company in question, we chose to visualize the data in Pareto Charts, but InfinityQS has more than 300 different types of charts for visualizing ZIP code information.

In addition to graph visualization, InfinityQS also generates alarms (based on pre-registered Specification Limits) and has Logbook support.

The solution enabled the company in question to reduce the occurrence of defects by 97% for both rework and scrapping, thus remaining well above the target value of 80%.

Benefits

  • Increase in the quality of the products produced
  • 97% reduction in cases of product reprocessing and scrapping
  • Anticipating possible defects
  • Significant improvements in the manufacturing process
  • Greater operational efficiency
  • Usability for computing defects at the operator’s own workstation
  • Online monitoring by management of the occurrence of defects and the progress of the production process
  • Low cost of the integrated solution

Features offered

  • Product exchange via microterminal
  • Defect collection via microterminal
  • Automatic production counting
  • Integration with the ZIP Code System
  • Automatic Attribute CEP
  • Making information available online
  • More than 300 possibilities for analyzing attribute ZIP code information
  • Alarms and alerts on the occurrence of defects, through alarms on graphs and sending e-mails
  • Logbook to correlate defects with changes and situations found on the production line

System interfaces

* Images with fictitious data (illustrative only)

RDE System – Points in InfinityQS
InfinityQS – Project with 1 Pareto chart

See other HarboR success stories

Software Validation at Libraport Campinas

Quality and Traceability

1,000% production increase with SPC

Automating quality control